We use a special image of the Sematext Docker Agent for swarm3k: sematext/sematext-agent-docker:swarm3k
Differences to the regular Sematext Docker Agent Setup:
- Metrics, Logs and Events are stored only in Logsene. This means the SPM backend will not be involved in the Swarm3k project.
- Kibana (integrated in Logsene) should be used for metrics visulisation.
- The metrics collection interval is set to a resolution of 1 minute. We expect 150k containers an like to reduce the amount of data to speed up Kibana queries.
- Metrics and Logs are tagged with swarm specific tags like NodeID, ServiceID and Swarm labels
- Collection of task status and task errors
- Get a free account at sematext.com
- We create a Logsene App to obtain an App Token for Logsene. This token is used to store system and container metrics, docker events and task errors. We use a write-only token for the deployment. This means the published token can't be used to query data.
If you need access to the swarm3k Logsene Apps, ask for an invitation - The deployment of Sematext Docker Agent to all swarm3k nodes, requires only one command on a Swarm master node:
docker service create --mode global \
--reserve-memory 128mb \
--restart-condition any \
--name sematext-agent-docker \
--mount type=bind,src=/var/run/docker.sock,dst=/var/run/docker.sock \
-e LOGSENE_STATS_TOKEN=b32b07c8-398e-4959-af9b-b713a1948585 \
sematext/sematext-agent-docker:swarm3k
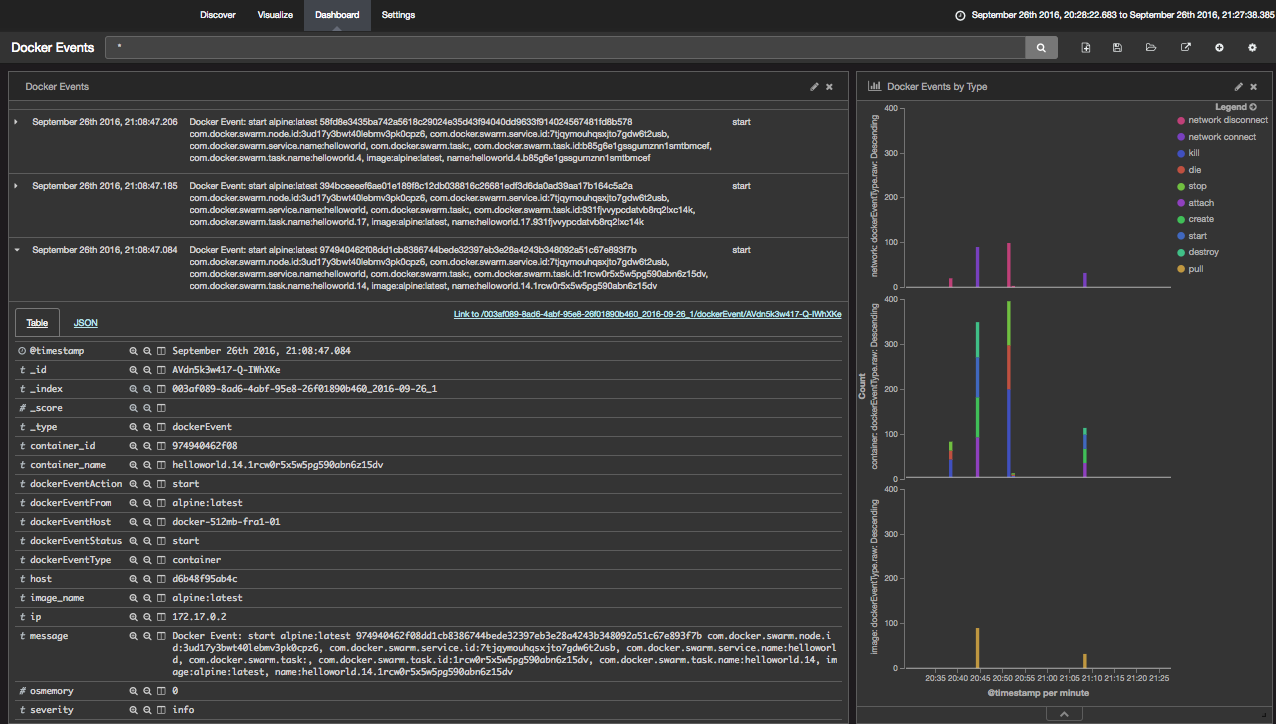
You’ll see your Docker Swarm metrics in Logsene swarm3k App after about a minute. Then open "Kibana / Dashboards" in Logsene. Or visit the public swarm3k monitoring dashboard.
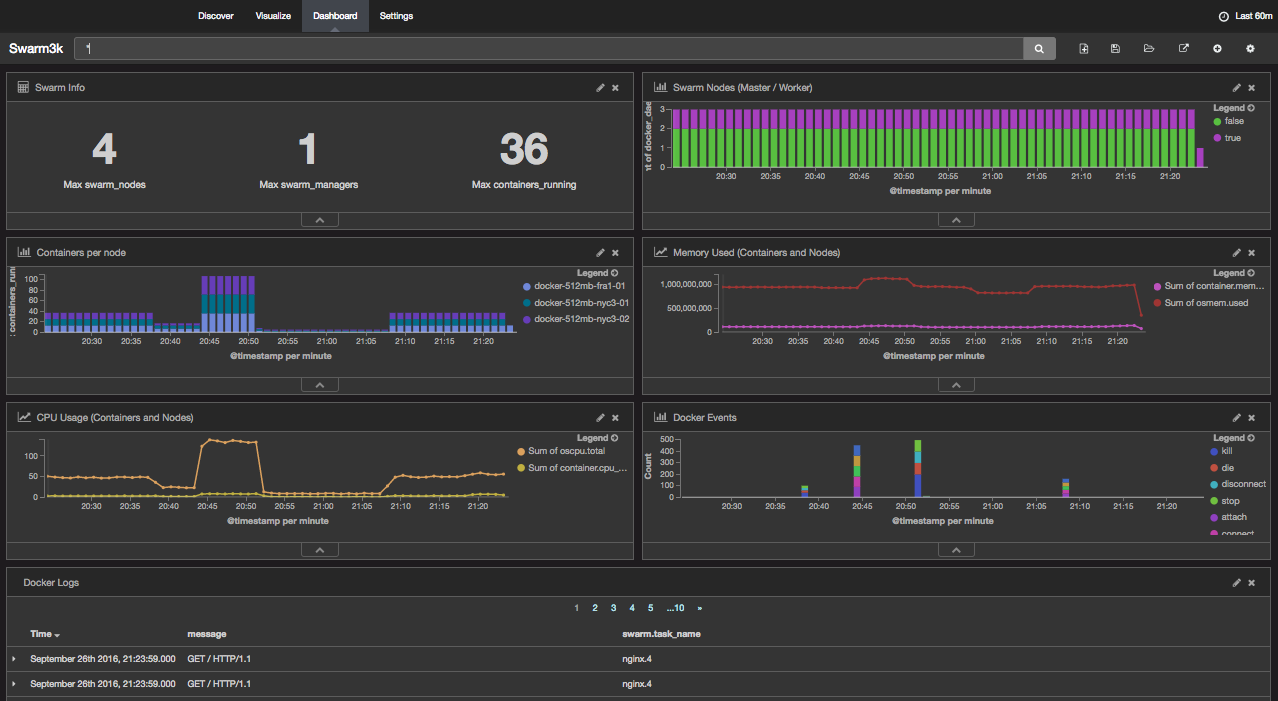
Public Grafana dashboards are available here. If you need admin access to Grafana Dashboards, sign up and ask for the access permissons.
{
    "@timestamp": "2016-09-26T16:36:47.975Z",
    "message": "stats for container helloworld.6.4z2ibua9otvnmlig85efkz56n 27b2802d7646",
    "severity": "stats",
    "host": "d6b48f95ab4c",
    "ip": "172.17.0.12",
    "container_id": "27b2802d7646",
    "image_name": "alpine:latest",
    "container_name": "helloworld.6.4z2ibua9otvnmlig85efkz56n",
    "container": {
      "cpu_stats_cpu_usage_cpu_percent": 0.01776550323841934,
      "cpu_stats_throttling_data_throttled_time": 0,
      "network_rx_bytes": 126,
      "network_rx_packets": 3,
      "network_rx_errors": 0,
      "network_rx_dropped": 0,
      "network_tx_bytes": 6006,
      "network_tx_packets": 63,
      "network_tx_errors": 0,
      "network_tx_dropped": 0,
      "memory_stats_usage": 57344,
      "memory_stats_limit": 513794048,
      "memory_stats_failcnt": 0,
      "memory_stats_stats_pgfault": 0,
      "memory_stats_stats_pgpgin": 0,
      "memory_stats_stats_pgpgout": 0,
      "blkio_stats_io_service_bytes_recursive_0_value": 0,
      "blkio_stats_io_service_time_recursive_0_value": 0,
      "blkio_stats_io_wait_time_recursive_0_value": 0,
      "blkio_stats_io_service_bytes_recursive_1_value": 0,
      "blkio_stats_io_service_time_recursive_1_value": 0,
      "blkio_stats_io_wait_time_recursive_1_value": 0
    },
    "container_hostname": "27b2802d7646",
    "swarm": {
      "node_id": "3ud17y3bwt40lebmv3pk0cpz6",
      "service_id": "7tjqymouhqsxjto7gdw6t2usb",
      "service_name": "helloworld",
      "task_name": "helloworld.6"
    }
  }
{
 "_index": "80e5977e-c7d2-4570-8f66-xxxxxxxxx_2016-09-24_1",
 "_type": "dockerEvent",
 "_id": "AVdiZrZF417-Q-IWpyaz",
 "_score": null,
 "_source": {
   "@timestamp": "2016-09-25T17:31:01.741Z",
   "message": "Docker Event: attach alpine:latest 1597a0b63999c144fc3d434483079959f920cb1019a5d2184b2c5e329ab41458 com.docker.swarm.node.id:3ud17y3bwt40lebmv3pk0cpz6, com.docker.swarm.service.id:7tjqymouhqsxjto7gdw6t2usb, com.docker.swarm.service.name:helloworld, com.docker.swarm.task:, com.docker.swarm.task.id:akdljc7dg1qfn894vfwis134n, com.docker.swarm.task.name:helloworld.91, image:alpine:latest, name:helloworld.91.akdljc7dg1qfn894vfwis134n",
   "severity": "info",
   "host": "e9ce7415ce1e",
   "ip": "172.17.0.3",
   "dockerEventStatus": "attach",
   "dockerEventType": "container",
   "dockerEventAction": "attach",
   "dockerEventFrom": "alpine:latest",
   "image_name": "alpine:latest",
   "container_id": "1597a0b63999",
   "container_name": "helloworld.91.akdljc7dg1qfn894vfwis134n",
   "dockerEventHost": "docker-512mb-fra1-01",
   "tags": [
     "docker",
     "docker-512mb-fra1-01",
     "attach",
     "1597a0b63999c144fc3d434483079959f920cb1019a5d2184b2c5e329ab41458"
   ]
 }
{
    "@timestamp": "2016-09-26T16:08:59.982Z",
    "message": "docker info: 3 containers running on node docker-512mb-fra1-01",
    "severity": "info",
    "host": "8e0c38dfa146",
    "ip": "172.17.0.2",
    "CPUs": 1,
    "docker_daemon_id": "QO7I:6CR7:TFJC:T6SX:WKZC:CMOI:2QB4:PLHZ:QVEK:MLNE:HY2P:EO6G",
    "containers": 167,
    "containers_running": 3,
    "containers_paused": 0,
    "node_mem_total": 489.9921875,
    "images": 11,
    "node_name": "docker-512mb-fra1-01",
    "swarm_node_id": "3ud17y3bwt40lebmv3pk0cpz6",
    "swarm_nodes": 4,
    "swarm_managers": 1,
    "swarm_is_master": "true"
  }
{
    "@timestamp": "2016-10-05T08:50:14.034Z",
    "message": "swarm task metrics",
    "severity": "info",
    "host": "docker-2gb-nyc3-01",
    "ip": "172.17.0.2",
    "task_in_desired_state": 6,
    "task_not_in_desired_state": 0,
    "task_running": 62,
    "task_shutdown": 197,
    "task_starting": 43,
    "task_complete": 5,
    "task_failed": 6,
    "task_rejected": 3
  }
{
    "@timestamp": "2016-10-05T07:03:56.833Z",
    "message": "Error in swarm task: started / task: non-zero exit (137)",
    "severity": "error",
    "host": "docker-512mb-fra1-01",
    "ip": "172.17.0.2",
    "createAt": "2016-10-05T07:03:02.455Z",
    "updatedAt": "2016-10-05T07:03:57.958Z",
    "taskId": "9zkxhstf9dgzcdlzggu19lefp",
    "nodeId": "7n8dxv3u9dnnokjcv8hltm5dx",
    "serviceId": "6hm63ht29ix6xsw4o10gp1ia0",
    "slot": -1,
    "desiredState": "shutdown",
    "status": {
      "state": "failed",
      "message": "started",
      "error": "task: non-zero exit (137)"
    },
    "isInDesiredState": 0
  }
Exaples CPU/Memory (there are more like network, disk io, ...)
{
    "@timestamp": "2016-09-26T16:31:55.725Z",
    "message": "os stats for docker-512mb-nyc3-02",
    "severity": "info",
    "host": "d145039f49cf",
    "ip": "172.17.0.2",
    "oscpu": {
      "user": 8.301190675834311,
      "nice": 0,
      "system": 7.512996813684388,
      "idle": 84.13550226396109,
      "iowait": 0,
      "irq": 0,
      "softirq": 0.05031024652020795,
      "steal": 0,
      "total": 15.864497736038906
    },
    "hostname": "docker-512mb-nyc3-02",
    "node_id": "e7herumhadti45itzlvsli6yu"
  }
{
"_index": "003af089-8ad6-4abf-95e8-26f01890b460_2016-09-26_1",
"_type": "os",
"_id": "AVdnV-vH417-Q-IWgKDO",
"_score": null,
"_source": {
  "@timestamp": "2016-09-26T16:32:57.571Z",
  "message": "os stats for docker-512mb-nyc3-01",
  "severity": "info",
  "host": "e210f0b47a25",
  "ip": "172.17.0.2",
  "osmem": {
    "used": 374808576,
    "free": 55402496,
    "cache": 66183168,
    "buffer": 17399808,
    "swapd": 0,
    "si": 0,
    "so": 0
  },
  "hostname": "docker-512mb-nyc3-01",
  "node_id": "7n8dxv3u9dnnokjcv8hltm5dx"
},
From a Docker Compose Project
{
   "@timestamp": "2016-09-25T17:32:22.421Z",
   "message": "Warning: mysqli::mysqli(): (HY000/2002): php_network_getaddresses: getaddrinfo failed: Name or service not known in - on line 19",
   "severity": "info",
   "host": "docker-512mb-fra1-01",
   "ip": "172.17.0.3",
   "logSource": "wordpress:latest_wordpress_wordpress_1_53f6353a46a3",
   "container_id": "53f6353a46a3",
   "image_name": "wordpress:latest",
   "container_name": "wordpress_wordpress_1",
   "container_hostname": "53f6353a46a3",
   "compose_project": "wordpress",
   "compose_container_number": "1",
   "compose_service": "wordpress"
 }
From a Swarm Service (_type: imageName) Nginx example. Logs are parsed and might create new fields in your Logsene App.
 {
   "@timestamp": "2016-09-26T16:39:39.000Z",
   "message": "GET / HTTP/1.1",
   "severity": "info",
   "host": "docker-512mb-fra1-01",
   "ip": "172.17.0.2",
   "logSource": "nginx:latest_nginx.3.erhzo45t40nb6vix4si7q75gl_f1829995501a",
   "client_ip": "10.255.0.3",
   "remote_id": "-",
   "user": "-",
   "ts": "26/Sep/2016:16:39:39 +0000",
   "method": "GET",
   "path": "/ HTTP/1.1",
   "status_code": 200,
   "size": 612,
   "referer": "-",
   "user_agent": "curl/7.35.0",
   "container_id": "f1829995501a",
   "image_name": "nginx:latest",
   "container_name": "nginx.3.erhzo45t40nb6vix4si7q75gl",
   "container_hostname": "f1829995501a",
   "swarm": {
     "node_id": "3ud17y3bwt40lebmv3pk0cpz6",
     "service_id": "7onbow9pk4e5xsgsfkjrz7t3r",
     "service_name": "nginx",
     "task_name": "nginx.3"
   }